
Short answer: Core Web Vitals are three Google metrics that measure real visitors’ experience of a page: Largest Contentful Paint (LCP) for loading, Interaction to Next Paint (INP) for responsiveness, and Cumulative Layout Shift (CLS) for visual stability. A page passes when, at the 75th percentile of visits, LCP is 2.5 seconds or less, INP is 200 ms or less and CLS is 0.1 or less. Google’s ranking systems use them, but they rarely outweigh relevance.
This guide is for site owners, marketers and developers who have seen “Core Web Vitals: failed” in Search Console or PageSpeed Insights and want to know what it means, how much it matters for SEO, and what to fix first. I have rewritten it for the current metrics (INP, not FID), with a short diagnostic you can run on your own page.
What are Core Web Vitals?
Core Web Vitals are the subset of Google’s Web Vitals that it considers most important for user experience. Each measures one part of how a page feels to a real person:
| Metric | What it measures | Good | Needs improvement | Poor |
|---|---|---|---|---|
| Largest Contentful Paint (LCP) | When the largest image or text block in the viewport has rendered | 2.5 s or less | 2.5 to 4 s | Over 4 s |
| Interaction to Next Paint (INP) | How long the page takes to visibly respond to clicks, taps and key presses, across the whole visit | 200 ms or less | 200 to 500 ms | Over 500 ms |
| Cumulative Layout Shift (CLS) | How much visible content moves unexpectedly while the page is in use | 0.1 or less | 0.1 to 0.25 | Over 0.25 |
The thresholds come from web.dev. They are assessed at the 75th percentile of page loads, separately for mobile and desktop. In plain terms, three out of four visits need to be “good” for the page to pass.
What happened to First Input Delay?
FID only measured the delay before the browser started handling the first interaction. Many pages passed FID and still felt sluggish. INP measures the full time to the next frame for every interaction during the visit and reports roughly the worst one, which is much closer to what users feel. If you read an older guide (including the earlier version of this one) that talks about FID, the advice on reducing JavaScript still applies, but the metric and its threshold have changed.
Do Core Web Vitals affect rankings?
Yes, but modestly. Google’s Core Web Vitals documentation says they align with what its core ranking systems seek to reward and that it highly recommends achieving good scores. Its page experience documentation also states that good scores do not guarantee top rankings. In my ranking factors list they are labelled confirmed, but light.
From audits, my view is:
- Relevance and content quality come first. A fast page that does not answer the query will not outrank a slower page that does.
- Very poor scores can hold a good page back, especially on mobile where most of the failures are.
- The bigger payoff is usually conversions. People leave slow, jumpy pages before they read or buy. My guide to web performance optimisation collects the published case studies.
- Chasing a perfect Lighthouse score is not the goal. Google uses field data from real Chrome users, not a lab score.
The 2021 page experience update is when Core Web Vitals first became part of ranking; the details of that rollout are in that article.
If you already have your numbers and want to know what they mean, paste them into the Core Web Vitals explainer, which rates each metric and tells you what to fix first.
Not sure if this is hurting your site?
Get the fixes that matter most, in priority order.
How Core Web Vitals are measured
Google’s figures come from the Chrome User Experience Report (CrUX): anonymised timing data from real Chrome users who have opted in, collected over a rolling 28-day window. That has three practical consequences:
- Changes take time to show. After a fix, field data improves gradually over about four weeks.
- Low-traffic pages may have no data of their own. Search Console groups similar URLs, and PageSpeed Insights may fall back to origin-level data for the whole site.
- Your audience’s devices matter. The same page scores worse if most visitors use mid-range Android phones on mobile data, which is the reality for many sites I work on in Pakistan.
| Tool | Data type | Best for |
|---|---|---|
| Search Console, Core Web Vitals report | Field (CrUX), grouped by similar URLs | Seeing which templates fail across the site |
| PageSpeed Insights | Field data for the URL or origin, plus a Lighthouse lab test | Checking one page and getting diagnostics |
| Chrome DevTools, Performance panel | Lab, on your own device, with live metrics | Finding the LCP element, long tasks and layout shifts |
| Real-user monitoring (for example the web-vitals JavaScript library) | Field, from all your visitors | Seeing which interactions and pages cause problems |
My free PageSpeed and Core Web Vitals checker pulls the field and lab data for a URL into one view.
Diagnose your page
Open PageSpeed Insights for one of your failing URLs, look at the field data at the top, then answer these questions.
Which Core Web Vital is holding your page back?
Does the field data section show a failing or “needs improvement” Core Web Vitals assessment?
Is LCP above 2.5 seconds?
In the lab diagnostics, is Time to First Byte (server response) slow, roughly over 0.8 seconds?
Is INP above 200 ms?
Is CLS above 0.1?
Result: a server problem is delaying LCP. Fix response time first: full-page caching, a faster host or plan, an up-to-date PHP version, and a CDN that caches HTML. Nothing on the page can render before the HTML arrives. Then check LCP and INP again.
Result: the LCP element loads too late. Find the LCP element in the diagnostics. Make sure it is not lazy-loaded, is served as WebP or AVIF at its displayed size, is in the HTML rather than injected by JavaScript or a slider, and has fetchpriority=”high”. Remove render-blocking CSS and scripts in the head. Then check INP and CLS too.
Result: JavaScript is blocking interactions. Record a Performance trace in Chrome DevTools while clicking menus, filters and buttons, and look for long tasks. Remove or delay heavy third-party scripts (chat, heatmaps, extra tags), break up long tasks, and reduce work in event handlers. Then check CLS.
Result: layout shifts are the problem. Add width and height to images and video, reserve space for ads, embeds and cookie banners, avoid inserting content above what the visitor is reading, and preload key web fonts with a suitable font-display setting.
Result: no Core Web Vitals problem in the field data. If the page passes, spend your time on content and relevance instead. If there is no field data at all, the page lacks enough Chrome traffic; check the origin-level data and the Search Console report for its URL group, and use lab results only as a guide.
How to improve LCP
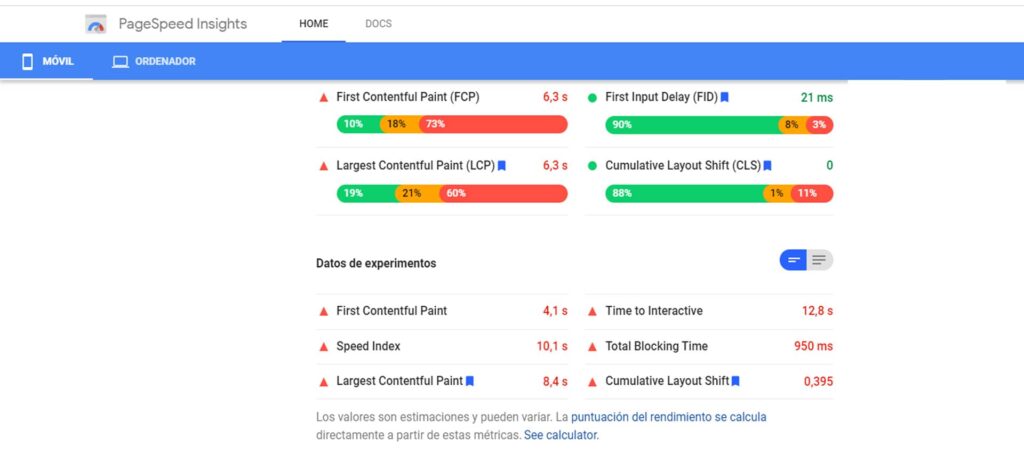
LCP has four parts: server response, the delay before the browser discovers the LCP resource, the time to download it, and the time to render it. On most sites I audit, the first two are the biggest.
- Speed up the HTML. Cache pages, reduce slow database queries and use a CDN. My guide to hosting, caching and CDNs covers the options.
- Let the browser find the hero early. Put the hero image in the HTML as a normal img element, not a CSS background or a JavaScript slider, and never lazy-load it.
- Prioritise it. Add fetchpriority=”high” to the LCP image, and preload it if it is referenced from CSS.
- Make it smaller. Serve WebP or AVIF, sized for the slot, with srcset for different screens.
- Remove render-blocking resources. Defer non-critical JavaScript and avoid large CSS files that every page loads.
<img src="/images/hero-800.webp"
     srcset="/images/hero-800.webp 800w, /images/hero-1600.webp 1600w"
     sizes="100vw" width="1600" height="900"
     fetchpriority="high" alt="Describe the image">
How to improve INP
INP is about the main thread. When JavaScript runs a long task, the browser cannot respond to a tap until it finishes. The fixes:
- Audit third-party scripts. Chat widgets, heatmaps, A/B testing tools, social embeds and duplicate analytics tags are the usual culprits. Remove what nobody uses and delay the rest until after interaction.
- Break up long tasks. Split heavy work into smaller chunks and yield to the main thread between them so input can be handled.
- Do less on each interaction. Update only the part of the page that changes, and avoid forcing layout recalculations in loops.
- Watch page builders and plugins. On WordPress, large builder scripts and plugins that load on every page add up. My Elementor fixes show what to switch off.
The full method for finding the slow interaction is in my Interaction to Next Paint guide.
How to improve CLS
- Images and video: always include width and height attributes (or a CSS aspect-ratio) so space is reserved.
- Ads and embeds: give ad slots and iframes a fixed minimum height.
- Banners and notices: show cookie and promotion bars as overlays, or reserve their space from the start.
- Web fonts: preload the main font and choose fallback fonts with similar metrics so the swap does not reflow text.
- Late content: do not insert “related products” or reviews above content the visitor is already reading.
Each cause, with how to spot it in DevTools, is covered in how to fix Cumulative Layout Shift.
Track and keep the gains
- Check the Search Console report monthly and after any theme, plugin or template change.
- Validate fixes in Search Console once deployed, so Google starts a fresh 28-day monitoring window for the affected URL group.
- Test new features before launch on a throttled mobile profile, not just a fast laptop.
- Agree a performance budget for page weight and third-party scripts, so marketing tags do not quietly undo the work.
For mobile-specific issues, such as heavy menus and pop-ups that only appear on small screens, see optimising Core Web Vitals for mobile.
Frequently asked questions
What are the three Core Web Vitals?
Largest Contentful Paint (loading), Interaction to Next Paint (responsiveness) and Cumulative Layout Shift (visual stability). INP replaced First Input Delay on 12 March 2024.
Are Core Web Vitals a ranking factor?
Yes. Google says Core Web Vitals are used by its ranking systems, but good scores do not guarantee top rankings and relevance matters far more. Treat them as a way to avoid losing out, and as a conversion improvement.
Why does PageSpeed Insights show a different score from Search Console?
The performance score in PageSpeed Insights is a lab result from one simulated load. Search Console shows field data from real users over 28 days. Google uses field data, so trust Search Console and the field section of PageSpeed Insights for pass or fail.
How long does it take for Core Web Vitals to update after a fix?
Field data uses a rolling 28-day window, so improvements show gradually over about four weeks. Use lab tools to confirm the fix works straight away.
Why do I see “not enough data” for my page?
The page does not have enough Chrome visits for its own field data. Google may assess it as part of a group of similar pages or at origin level. Improving the template usually fixes all pages in the group.
Sources
- Google Search Central, “Understanding Core Web Vitals and Google search results” (last updated 2025).
- web.dev (Google), “Web Vitals” (last updated 2024).
- web.dev (Google), “Interaction to Next Paint becomes a Core Web Vital on March 12” (2024).
- HTTP Archive, Web Almanac 2024, Performance chapter (2024).
If your Search Console report shows failing URL groups and you want them fixed in the right order, my website speed optimisation service starts from your field data, or you can send me a failing URL to look at.
Request received
Thank you! Saad will contact you within the next 24 hours.
Keep an eye on your phone and inbox.