Core Web Vitals, the new and dreaded Google update is here.
Google announced updates to the Page Experience ranking algorithm in May 2020. This update includes two key points:
- Three new performance metrics will be used as ranking signals for SEO .
- Top Stories no longer requires an AMPHTML page, and performance will become a ranking factor.
The update is great news for site speed fans: Google is placing an even greater emphasis on the speed of user experiences , offering two SEO benefits to site owners who deliver the fast experiences customers expect.
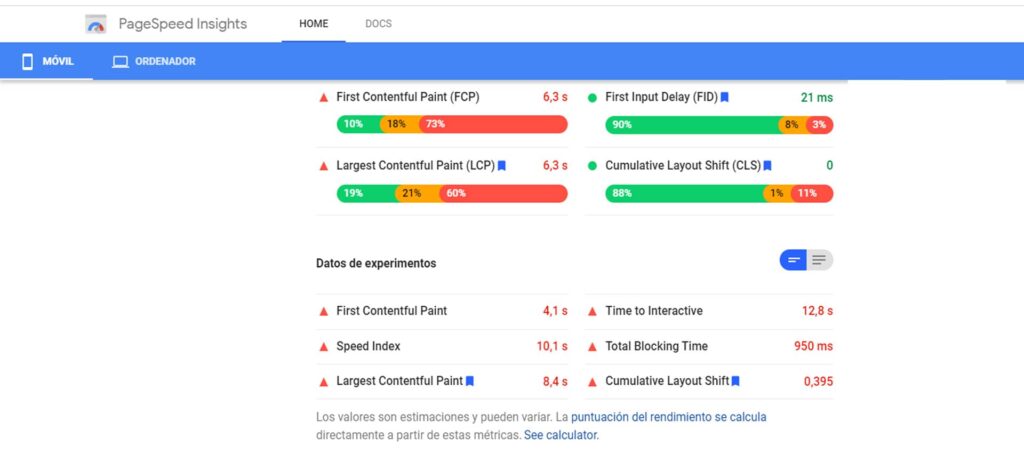
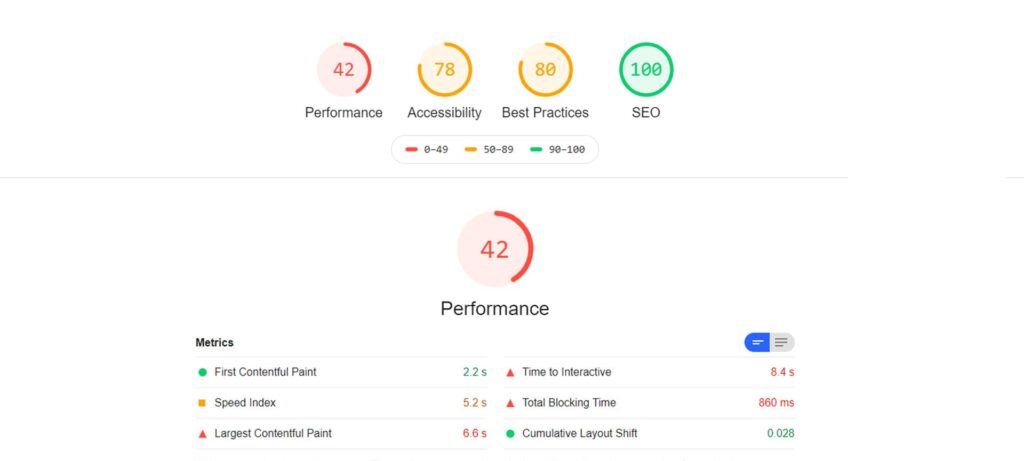
To see how you’re currently performing against these metrics, try running a page through PageSpeed Insights or web.dev/measure.
These Google tools will give you a performance score and let you know how a page compares to the new performance goals.
These performance metrics are designed to be universal measures of page speed and to be good proxies for perceived user experience, they should be valid measures of how the experience feels for almost all web pages.
That said, Google has stated that these metrics are constantly being reviewed and may change in the future.
First input lag is a measure of how long it takes for the browser to respond to user input, such as clicks or taps.
Cumulative layout shift is a measure of page instability, a sum of all unexpected layout shifts in the page lifecycle.
The recommended values above are determined from 75% of real user experiences: at least 75% of your page views must exceed the Good value to pass this assessment !
How Google Measures Speed for Core Web Vitals
The three new performance metrics are relatively new to the world of web performance, so they are currently only supported via the API in Blink-based browsers (Chrome, Chrome on Android, Chromium Edge).
The data Google will use for the page experience update comes from the Chrome UX Report (CRUX), a collection of anonymous performance statistics taken from real page loads in Chrome browsers around the world.
CRUX measures all regular page loads, both for home and mid-session pages, regardless of cache state.
It does not measure smooth navigations (route changes) within single-page applications.
This means that smooth sailings will potentially be penalized , with higher than expected CLS scores and missing or unfairly high LCP values.
Unfortunately, there is still no good solution to this problem.
This makes it even more important to reduce unexpected displacements in the layout and optimize the LCP as much as possible.
The update comes with a set of recommended speed targets, these are measured on 75% of CRUX data, so at least 75% of measured experiences should meet or exceed these targets.
Cache and session state are not available in the CRUX dataset, so the 75th percentile value is taken from all page loads, with or without cache.
PageSpeed Insights will give you three sets of performance metrics, where available:
- Field – the CRUX data for the given URL.
- Source Summary: The aggregated field data from all your pages.
- Lab: A test performed from a Google server that applies throttling.
If your page does not have enough traffic to produce the field data , you will only get the source summary result.
Recommendations and diagnostics in PageSpeed Insights are produced from lab testing , performance metrics should be taken from field results.
The recommendations should give you a general idea of areas for improvement that will have a positive impact on your website’s bottom line.
Optimizing Results for Core Web Vitals
Let’s talk about how to measure, diagnose, and improve each of the three new metrics: LCP, FID, and CLS, in turn. Remember that any optimization to improve these metrics will almost certainly make your pages faster and improve the user experience.
Higher content (LCP)
The LCP is a time point measured when the largest element above the fold is displayed on the screen.
In most cases this is a main image/video or the main text block on the page.
LCP is a good alternative to “page load time” – it measures everything it takes for your website to render the key content of a page – DNS, TLS, HTML, CSS, and blocking JavaScript – but does not include asynchronous scripts or lazily loaded content .
LCP occurs only after three stages of page loading have been completed:
- HTML delivered and parsed.
- Download, analyze and process critical path assets.
- Downloaded and rendered LCP asset (image, video, web font, etc.).
Fast document delivery is one of the most important things you can do to improve page speed – if you can reduce it by 100ms, all other duration metrics will be 100ms faster.
Fast document delivery comes down to a few key optimizations for Core Web Vitals:
-
- DNS – DNS is the address book of the Internet. Optimize DNS by increasing TTL and using a globally distributed DNS service.
-
- TCP – The limiting factor for establishing a TCP connection is (usually) the round-trip time between the user and the server. Use a content delivery network to minimize this.
-
- TLS – Secure websites require one or more additional round trips to create a secure connection. Make sure you have OCSP stapling enabled on your site certificate (you can even downgrade from EV to OV to achieve this!) and that your server or CDN is configured to support TLS v1.3
-
- TTFB – The time to first byte of your website is limited by how quickly the server can create the response. If possible, it should be cached on a CDN or reverse proxy. If HTML caching is not possible (for example, if there is customization on the page), make sure your server environment is capable of delivering pages within 100ms.
- HTML – It may seem obvious, but the size and structure of the HTML document is critical to performance. Make sure the HTML document is compressed and less than 50kB on the network.
- Make sure the HTML document is compressed and less than 50kB on the network. Pay attention to the <head> of the document to make sure the <title> is first and that there are no blocking third-party <script> tags.
Once the HTML is downloaded, the browser scans the document line by line to find resources on the critical path.
The CSS and JavaScript in the head are given very high priority, and then the body images are downloaded in the order they appear.
If the browser parser sees a script tag that is blocking (i.e. without the async or defer attribute), it will stop whatever it is doing while it fetches, parses, and executes that script.
Therefore, scripts should always be asynchronous , when the order of execution is not important, or deferred when the order of execution is important .
It also makes sense to review inline scripts to reduce their impact.
Whenever possible, split your JavaScript bundle by page and by modern JavaScript support. This will allow you to ship the smallest possible bundle and use modern technologies when they are supported.
Note that the module has different behavior by default:
<script type="module "src="/app-homepage.esm.js"></script><script nomodulesrc="/app-homepage.js"></script>
The next step in the critical path is loading the stylesheets: without CSS the browser doesn’t know how to render the page so it will block rendering at any tag.
Make sure CSS is grouped per page to reduce unnecessary weight, you can retrieve and cache a full stylesheet later in the page lifecycle using the media=»none» hack (ensuring this file won’t cause a layout shift!):
<linkrel="stylesheet "href="lazy.css "media="none "onload="this.media='all'">
LCP is measured independently of the cache state, so make sure your static assets (JavaScript, CSS, images, and fonts) can be cached in the browser for at least one hour with a response header like “ cache-control: max-age: 3600 ”.
Also make sure your text assets are compressed with gzip or brotli, this will help improve your Core Web Vitals.
A common problem I see, especially on eCommerce sites, is a large number of non-critical images loading at the top of the page, such as in the definition of a mega menu.
Native lazy – loading is a great technique to optimize LCP by reducing bandwidth contention during page load.
The loading attribute is not yet supported in Safari, but it is supported in WebKit and is currently available in Safari on iOS behind a flag, so we can expect general support soon.
It’s supported on all browsers that send data to CRUX, so implement it now to benefit from the data that will power your Page Experience SEO update .
<imgsrc="menu-img.jpg "alt="... "width="200 "height="200 "loading="lazy"><imgsrc="hero-img.jpg "alt="... "width="1024 "height="600 "loading="eager">
Make sure your hero element has a ‘loading=’eager’ attribute and any images that are below the fold or hidden by default have a ‘loading=’lazy’ attribute.
This simple optimization allows the browser to prioritize downloading important assets earlier, improving LCP and user experience. Learn more at web.dev
It goes without saying, but if your primary asset is an image or video, it should be delivered in the most browser-optimized format.
This may mean that a third-party service like Cloudinary or Akamai Image and Video Manager is a good option for dynamically optimizing your media content.
The hero element should not be tied to JavaScript, so it’s best to replace image carousels and embedded video players with static images.
First Input Delay (FID) to improve Core Web Vitals
FID is a measure of how long the browser has been busy with other tasks before it can react to a discrete user input event, such as a tap or click.
It is an indication of how responsive the UI is to the user and how busy the CPU is with JavaScript processing.
The only consistent way to improve FID without degrading user experience is to reduce JavaScript execution time, both on page load and throughout the page lifecycle.
An easy way to game this metric would be to hide the content (perhaps behind a loading screen/spinner) until the JavaScript has finished executing, so that your visitors don’t try to interact before your app is fully ready.
However, this will most likely negatively impact your LCP and CLS metrics, so be careful.
Assuming we are trying to improve FID and improve visual performance, we only have a few options:
- Delay or eliminate third parties
- Defer non-critical scripts
- Improve JS performance
The first task is to run a performance trace on a key page to see where the main thread time is being consumed. Any large chunks are cause for concern and should be investigated.
Focus on long tasks , as they are singular blocks of execution that are more likely to cause high first-input delays.
Cumulative Design Displacement (CLS)
CLS is a measure of the stability of the user interface as the user loads and interacts with a page. It is the sum of unexpected layout changes during the page’s lifecycle, such as when a banner ad loads and displaces the main content of the page.
Layout change scores are derived from the impact the change has on the viewport – a product of the amount of change in the viewport and the distance the element is moved. A perfect cumulative score is zero, 0.1 is good.
Unexpected layout shifts mean that they do not occur immediately after a discrete user interaction, so they are likely to have a negative impact on the user experience.
CLS is measured with CRUX throughout the lifecycle of a page, from the start of navigation until the user leaves the page.
Any unexpected design changes are added up over this time and the total score is used for measurement, making it a difficult metric to measure in a lab environment.
This also means that tools like WebPageTest and mPulse will report the best-case CLS scenario to draw conclusions from your Core Web Vitals, they will only collect this data while the page is loading and ignore other changes like those that occur during scrolling.
Optimizing CLS to improve an aspect of Core Web Vitals during page load is reasonably straightforward, we just need to avoid layout shifts. The causes of layout shifts are multiple, so let’s look at some of them and how to avoid them.
- Web Fonts – Match your web font characters and line spacing to the fallback font.
- Ads – Pre-allocate layout slots for ads, use a fallback image if ads fail or crash.
- Late-loading CSS: Ensure that layout-critical CSS is on the critical path.
- Images: Always add a width and height attribute for images so that the browser can allocate space before the image is downloaded.
- Dynamic Content: Where possible, pre-allocate layout space for dynamic elements.
Chrome Developer Tools now has a handy way to identify which elements caused a layout shift and how they contributed to the cumulative score of the layout shift.
If you hover over the layout change in experience tracking, Chrome will highlight the element on the page. Note that the details show you where the element has moved from and to where.
I recommend that you configure the network and CPU throttling options in the Performance tab, as this will make it more likely that you will detect layout shifts that occur in the wild due to network race conditions.
Once you have identified the elements that are causing design shifts, it is time to determine how to reduce or prevent them.
When the web font loads, the text element scrolls as the characters are more condensed and the element is sized to fit the content.
In this case it is a small layout change, but the impact on the body text can be much greater, as the text overflow can cause the body element to resize.
It might be possible to fix this by matching the system font to the web font, using font-face descriptors, but the most robust way to avoid font-based layout changes is to preload the web font and use font-display: optional.
This combination gives the browser the best chance of having the web font(s) available when it needs them, but allows the browser to use the fallback font in case the web font is not available.
This ensures that there will be no layout shift due to fonts, both for the initial page load and for subsequent page loads that will use the now cached web font.
Other vital aspects
Although the initial Page Experience update defines LCP, FID, and CLS as Core Web Vitals , these may change over time.
There are a host of other metrics that provide additional value and are worth tracking and optimizing.
Below are some other key metrics you may want to track and improve.
FCP for Core Web Vitals
While LCP measures the largest paint on the screen, FCP measures when the first paint occurs.
This is an important metric for several reasons, most notably because it is the first time the user knows that their navigation is actually working.
This time point also correlates well with when the user’s browser switches context from the previous page.
FCP is usually identical to the first paint, or very soon after. The first paint includes non-visible elements in the calculation, while FCP only measures content that is visible to the user. In this case, the site logo and header:
Time to Interactivity (TTI)
Time to Interactivity (TTI) is an approximation of how long the page will feel interactive if a user attempts to interact.
This time point is measured between the first Contentful paint and when the main thread has been free of long tasks for at least five seconds.
Getting this metric as low as possible will ensure that your users have a great experience when trying to interact with your pages.
Use TTI with TBT to get an overall picture of how busy the browser is when your pages are loading.
Total Block Time (TBT)
Total Block Time (TBT) is a measure of how busy the browser’s CPU was while the page was loading, measured as the sum of long tasks (less than 50ms each) between FCP and TTI. Reducing this time will likely improve the user experience and may help improve perceived performance as well. Look for large long tasks in your JavaScript profiles and try reducing, removing, or delaying them.
How to track performance
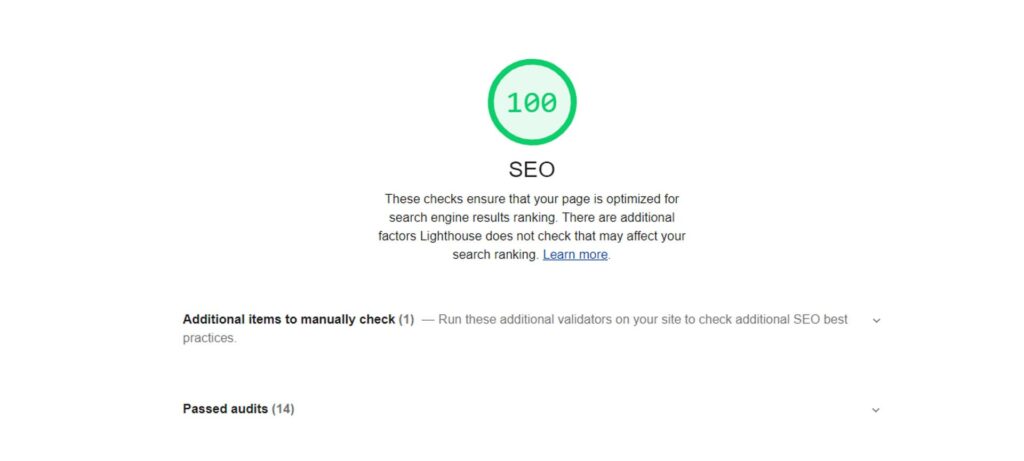
Google tools like PageSpeed Insights, Lighthouse, and web.dev will provide you with a measurement of your site’s Core Web Vitals.
However, the “field” data has some limitations: the data is collected only from Google Chrome users who have opted into the collection of anonymous usage statistics, and is aggregated monthly with a one- to two-week delay.
If you want to track core web vital characteristics more comprehensively, look into a real-user measurement solution like Akamai and mPulse.
RUM tools can collect performance data from all supported browsers and provide you with real-time insights into how your performance is tracking.
You can also quickly detect issues with specific pages or devices, making the data actionable.
Conclusion and Actions
The proposed page experience update will likely occur in mid-2021. This is the most important factor of google rannking and it will impact SEO as well as the eligibility criteria for Top Stories in Google SERPs.
Google has proposed three new performance metrics to be used as signals for this SEO update, with selection based on their adjacency to user-perceived performance and the ability to collect the data on the ground.
Optimizing these performance metrics, as measured by Google in CRUX, could have a positive impact on rankings in the future, but will certainly have a positive impact on user experience.
We know that faster experiences lead to lower bounce rates, longer session durations, better satisfaction scores, increased conversions, increased SEO traffic, increased revenue… So why wait?